NCC 2019 vs NCC 2022 Glazing Requirements
This article outlines the most important changes regarding the thermal performance of windows, comparing NCC 2022 glazing with NCC 2019. The window performance values (i.e. U-value and SHGC) are extracted from the ABCB Glazing Calculator. Here, we show how much of a change should you expect migrating from NCC 2019 to NCC 2022, for a compliant glazing in each climate zone. Also, thermal modelling has been undertaken for the NCC 2019 Reference Building to show the impact of the new changes in NCC 2022.

Key points of this article
New NCC 2022 Requirements Regarding the Performance of External Glazing
Windows makes you feel connected to the outside world and makes you feel luxuries and enjoy spending time in your home. However, having large windows with huge areas comes at a price! Building construction codes only require you to have just enough window area for the introduction of natural light, ventilation or solar heat for winter; The more you want, the more you will have to pay. For your building to comply with the Building Code of Australia, the greater window area relates to better thermal performance but at a greater cost.
Due to the ever-growing energy use of our society and its impact on climate change, the Building Board of Australia (ABCB) require buildings to be more energy-efficient. They reflect these decisions in new building code versions. For this matter, we expect the Performance Requirements of building fabric in NCC 2022 to be more demanding and costly than NCC 2019.
We usually don’t extract the performance requirements for external glazing from the code. To make things simple, we use the ABCB Glazing Calculator (2019 or 2022) and extract the compliant U-value and SHGC from it. The following section compares the window performance requirements (U-value and SHGC) as required by NCC 2019 and NCC 2022. Our conclusions are also presented in the last section.
Changes in NCC 2022 Glazing Requirement
To compare NCC 2022 glazing with NCC 2019, we need a Reference Building. We extract compliant U-value and SHGC from the Glazing Calculator for this Reference Building. The following section shows the characteristics of this Reference Building.
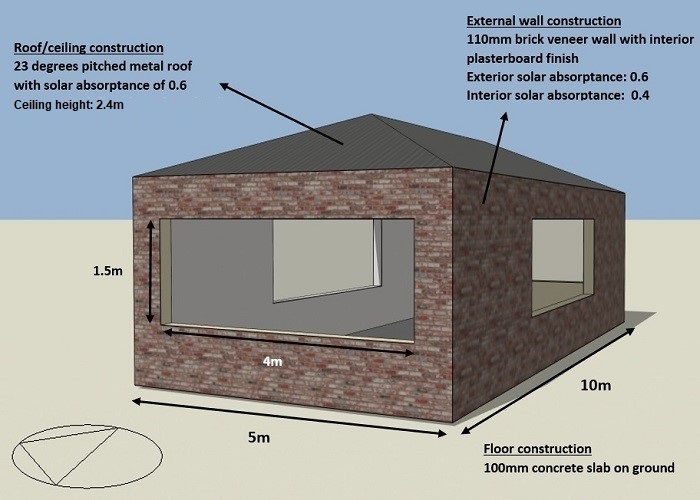
General Reference Building Characteristics
Roof: Pitched roof (23 degrees) with solar absorptance of 0.6.
Ceiling: 2.4m horizontal, 10 mm plasterboard ceiling.
Roof and ceiling insulation: In accordance with NCC 2019 Vol 2.0, Part 3.12.1.2.
Roof lights: No roof lights
External walls: 110mm masonry veneer with a solar absorptance of 0.6.
Wall insulation: The minimum Total R-value specified in NCC 2019 Vol 2.0 Part 3.12.1.4.
Internal walls: 70 mm timber frame with 10 mm internal plaster lining.
Ground floor: Concrete slab-on-ground, insulated under NCC 2019 Vol 2.0 Part 3.12.1.5.
Glazing: In accordance with NCC 2019 and NCC 2022 Glazing Calculator.
Air movement: high air movement
Infiltration: 0.6 ACH infiltration allowed all the time.
Internal heat gains: 5 W/m2 averaged over 24 hours.
For this sensitivity analysis, first, we need to extract NCC 2019 and NCC 2022 glazing performance requirements from the ABCB Glazing Calculator. Note that there are several major changes in NCC 2022 glazing calculator:
- In NCC 2019 Glazing Calculator, each floor had to be separately assessed. However, in NCC 2022 Glazing Calculator, all floors could be assessed in one file.
- The impact of floor covering and window frame colour is included in NCC 2022 Glazing Calculator.
- In NCC 2019, you should calculate air movement inside the building on your own and then insert the result of your calculation inside the Glazing Calculator; however, in NCC 2022 Glazing Calculator, you only specify the type of space served and window opening and the rest is up to the Calculator!
- Unlike NCC 2019, any U-value is acceptable in Climate Zone 1. Therefore, you shall aim for the highest U-value to reduce construction costs.
- Unlike NCC 2019, any SHGC is acceptable in Climate Zone 8. Therefore, you shall aim for the highest SHGC to maximise solar gain and reduce heating demand and consequently, energy bills.
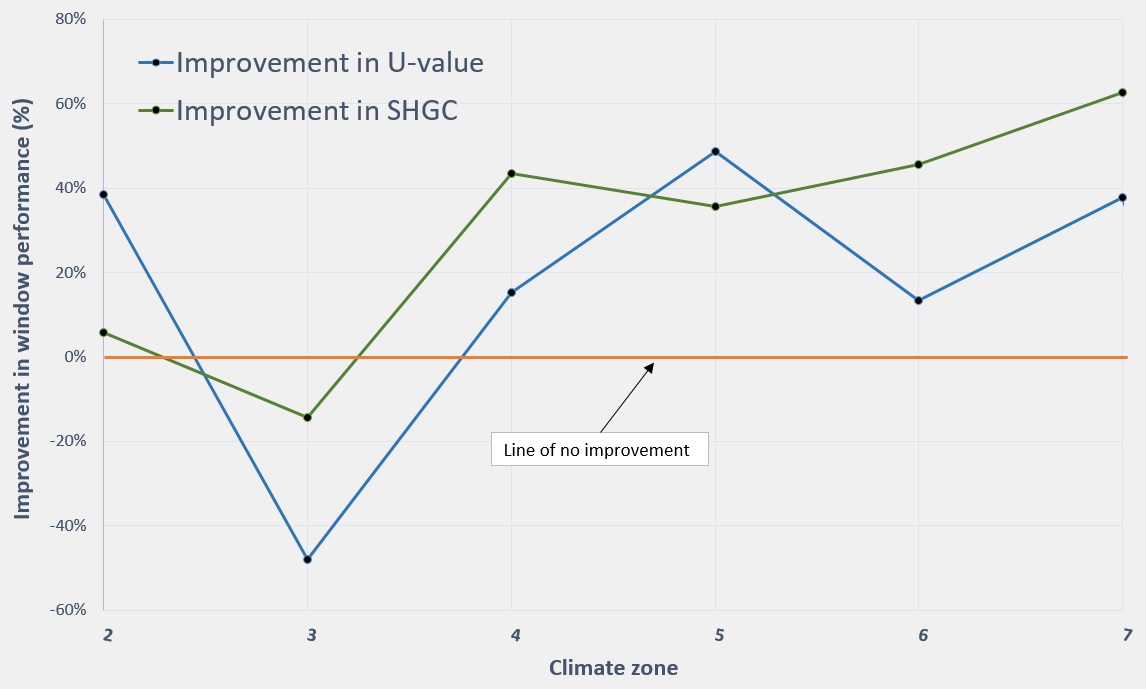
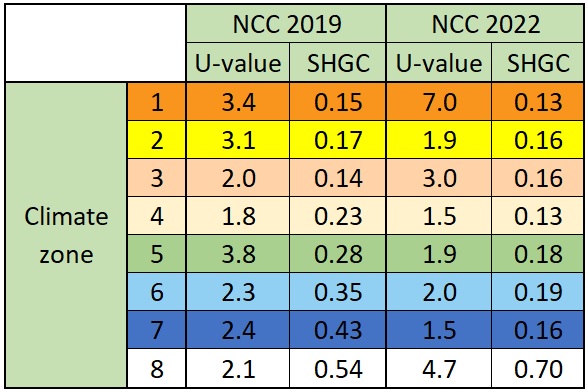
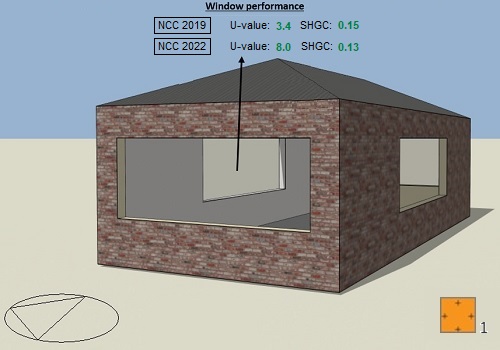
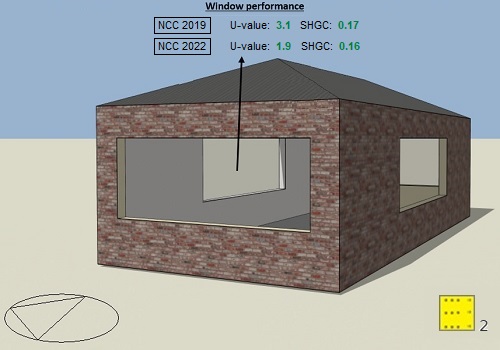
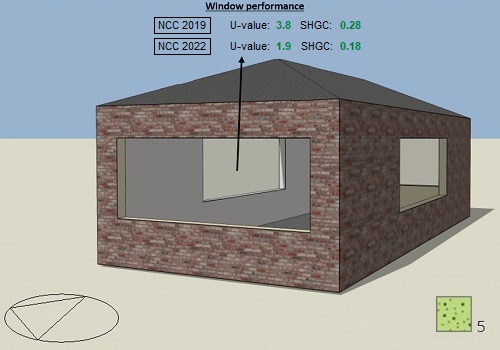
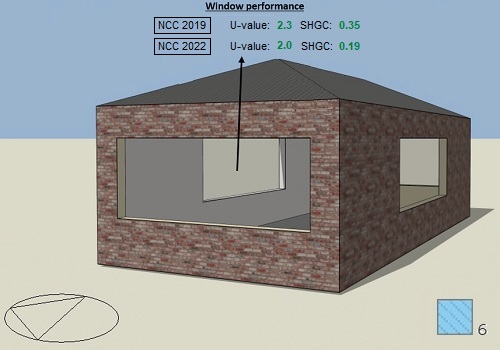
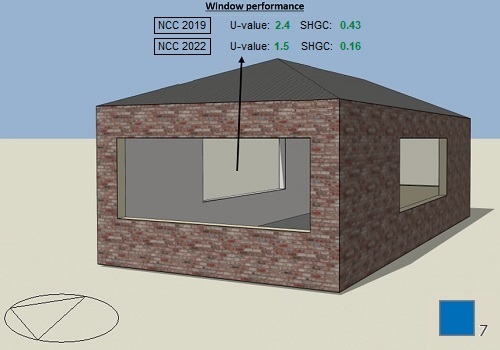
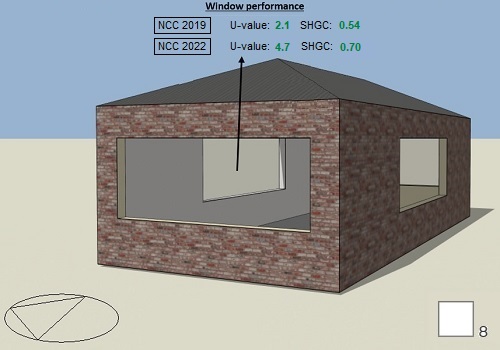
The following table shows this extracted U-value and SHGC from the Glazing calculator for the 50m2 Reference Building in different climate zones. Changes in the required thermal performance values are also shown in the figure below:
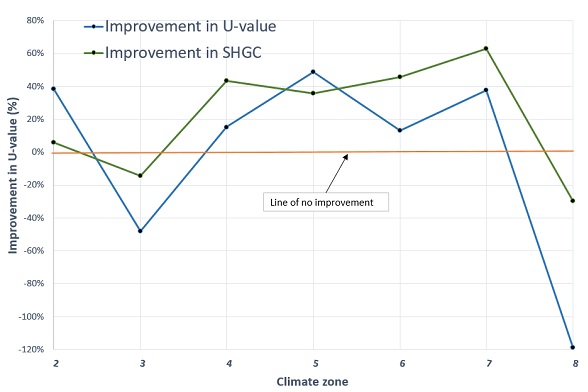
The above figures show a general improvement in window performance as required by NCC 2022. However, you should note that:
- U-value is not improved for climate zone 1, because the U-value does not play a significant role in reducing cooling demand in climate zone 1. Therefore, you should expect relatively low-cost glazing for the buildings built according to NCC 2022.
- U-value is not improved for climate zone 8, which is rather odd! Because U-value plays a very significant role in the reduction in heating demand of the building. The reason behind this is that there is no limit on how high SHGC could get in climate zone 8. The more the compliant SHGC, the more the U-value; that’s how the glazing calculator works!
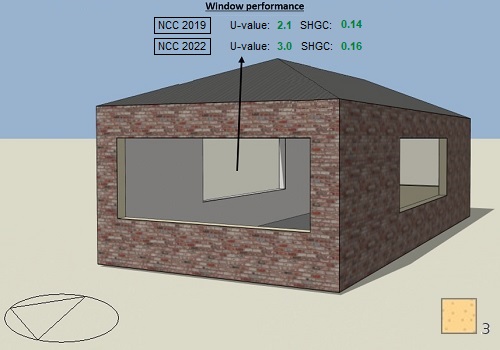
- There are no glazing improvements for buildings in climate zone 3.
- Considering climate zones 1 and 8, there are no improvements in U-value, but considering only climate zones 2 to 7, a general 20% improvements are expected for window U-value.
- Considering climate zones 1 and 8, a 20% improvement in window SHGC is expected. However, if we exclude climate zone 1 and 8, for the other climate zones, a 30% improvement in window SHGC is expected.
Impact of NCC 2022 glazing on space heating and cooling
To compare the impact of NCC 2022 glazing on space heating and cooling demand and to compare it with NCC 2019, we need a Reference Building with compliant window performance values from each code. These Reference Buildings are the same, the only difference is their window performance values (U-value and SHGC) that are extracted from the Glazing Calculator. The following section shows the outcomes of our case study for the following:
- NCC 2019 Reference building with NCC 2019 glazing
- NCC 2019 Reference building with NCC 2022 glazing
Space heating, space cooling and total thermal demand of the above cases are shown below:
Climate Zone 1
Climate Zone 2
Climate type:
Example city:
Weather file name:
Annual heating demand:
Annual cooling demand:
Total thermal demand:
Hot humid summer, warm winter
Cairns, QLD
AUS_QLD_Cairns.Intl.AP.942870_TMYx.2007-2021
Not significant
NCC 2019: 352.7 MJ/m2 – NCC 2022: 337.0 MJ/m2
See below
Climate type:
Example city:
Weather file name:
Annual heating demand:
Annual cooling demand:
Total thermal demand:
Warm humid summer, mild winter
Brisbane, QLD
AUS_QLD_Brisbane.945760_TMYx.2007-2021
Not significant
NCC 2019: 161.3 MJ/m2 – NCC 2022: 167.3 MJ/m2
See below
Climate Zone 3
Climate Zone 4
Climate type:
Example city:
Weather file name:
Annual heating demand:
Annual cooling demand:
Total thermal demand:
Hot dry summer, warm winter
Alice Springs, NT
AUS_NT_Alice.Springs.AP.943260_TMYx.2007-2021
NCC 2019: 35.8 MJ/m2 – NCC 2022: 47.7 MJ/m2
NCC 2019: 222.0 MJ/m2 – NCC 2022: 240.3 MJ/m2
See below
Climate type:
Example city:
Weather file name:
Annual heating demand:
Annual cooling demand:
Total thermal demand:
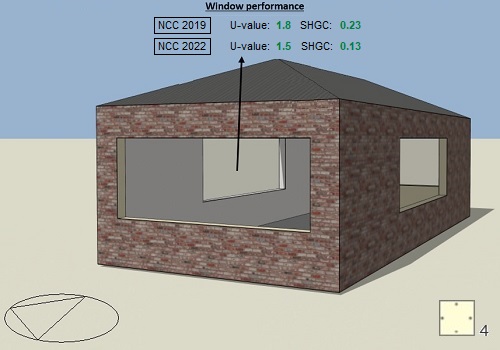
Hot dry summer, cool winter
Kalgoorlie, WA
AUS_WA_Kalgoorlie.AP.946370_TMYx.2007-2021
NCC 2019: 27.1 MJ/m2 – NCC 2022: 46.3 MJ/m2
NCC 2019: 167.0 MJ/m2 – NCC 2022: 107.9 MJ/m2
See below
Climate Zone 5
Climate Zone 6
Climate type:
Example city:
Weather file name:
Annual heating demand:
Annual cooling demand:
Total thermal demand:
Warm temperate
Sydney, NSW
AUS_NSW_Sydney.Intl.AP.947670_TMYx.2007-2021
NCC 2019: 33.9 MJ/m2 – NCC 2022: 24.8 MJ/m2
NCC 2019: 98.3 MJ/m2 – NCC 2022: 72.0 MJ/m2
See below
Climate type:
Example city:
Weather file name:
Annual heating demand:
Annual cooling demand:
Total thermal demand:
Mild temperate
Melbourne, VIC
AUS_VIC_Melbourne.Olympic.Park_TMYx.2007-2021
NCC 2019: 114.1 MJ/m2 – NCC 2022: 134.5 MJ/m2
NCC 2019: 46.7 MJ/m2 – NCC 2022: 18.9 MJ/m2
See below
Climate Zone 7

Climate Zone 8
Climate type:
Example city:
Weather file name:
Annual heating demand:
Annual cooling demand:
Total thermal demand:
Cool temperate
Hobart, TAS
AUS_TAS_Hobart.Ellerslie.Road_TMYx.2007-2021
NCC 2019: 152.0 MJ/m2 – NCC 2022: 218.4 MJ/m2
Not significant
See below
Climate type:
Example city:
Weather file name:
Annual heating demand:
Annual cooling demand:
Total thermal demand:
Alpine
Thredbo, NSW
AUS_NSW_Thredbo.Village_TMYx.2007-2021
NCC 2019: 98.1 MJ/m2 – NCC 2022: 147.4 MJ/m2
Not significant
See below
Conclusion
In the above sensitivity analysis, we only applied external glazing’s Performance Requirements from the NCC 2022 Glazing Calculator and compared it to that of the NCC 2019; therefore, other requirements for roof/ceiling, external walls and floors are neglected. Knowing this, the following figure shows the improvement in the building’s energy efficiency (decrease in thermal energy demand) by applying NCC 2022 glazing alone.
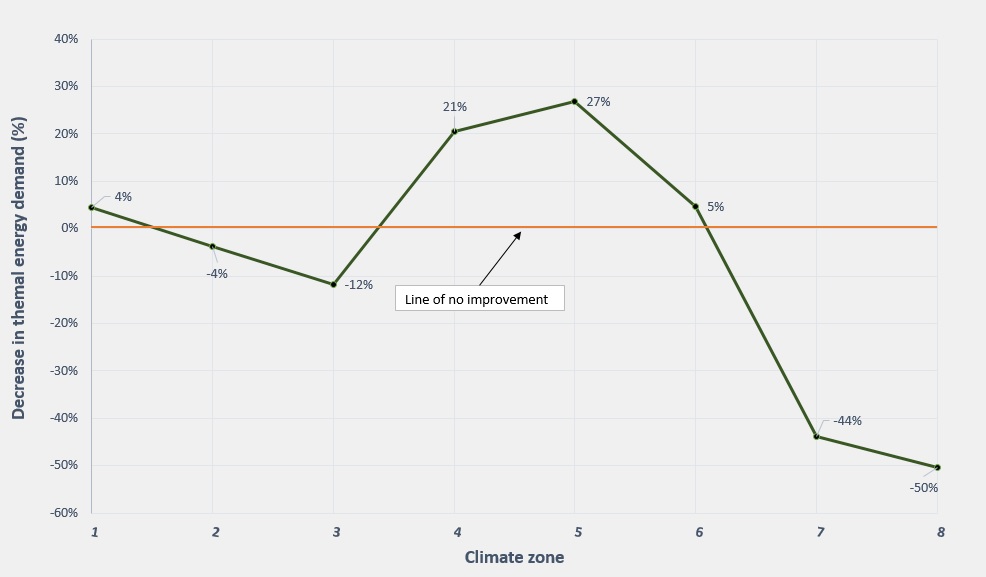
Above figure shows that:
- Improvement of glazing (decreasing U-value and SHGC) does not necessarily relate to a decreased thermal energy demand. Decreasing SHGC reduces cooling demand but increases heating demand. Orientation of glazing and indoor spacing layout also determines the expected decrease or increase in heating and cooling demand of the building.
- Impact of glazing improvement is expected to be overall positive in climate zones 4 and 5.
- In climate zone 7, improved SHGC as required by NCC 2022, does not solely decrease the thermal demand of the building. For this climate zone, reducing thermal demand is also related to the other requirements of the code for roofs, walls and floors.
- Due to glazing improvement alone, not much change in thermal demand is expected to occur for buildings in climate zones 1, 2 and 6.
- Increasing the NCC 2022 acceptable allowance for SHGC in climate zone 8 is expected to be generally negative since the acceptable U-value increases with the increase in SHGC. This means that for a building with a high glazing-to-floor area ratio, the NCC 2022 Reference Building is less efficient than the NCC 2019 Reference Building.
- Using the VURB method to comply with the energy efficiency requirements, grants a good opportunity to decrease window costs and have clear windows instead of compliant tinted windows with low U-value for climate zones 6 and 7.
